This post is just an initial demonstration about the differences of the matte black ink between two different third party ink manufacturers' dedicated black and white inksets. This will not explain the differences between the processes of how the inks are used, but only that they are not interchangeable and will require custom profiling depending on which inks are used.
This came up recently on a Yahoo group discussion about the interchangeability of the two different shade 1 inks, and is an further explanation of my comment there. This will not be an explanation of the QuadTone Rip profiling/calibration process so some of what follows might not make sense to those who are not familiar with the QTR profiling and printing process.
The Measurement Process
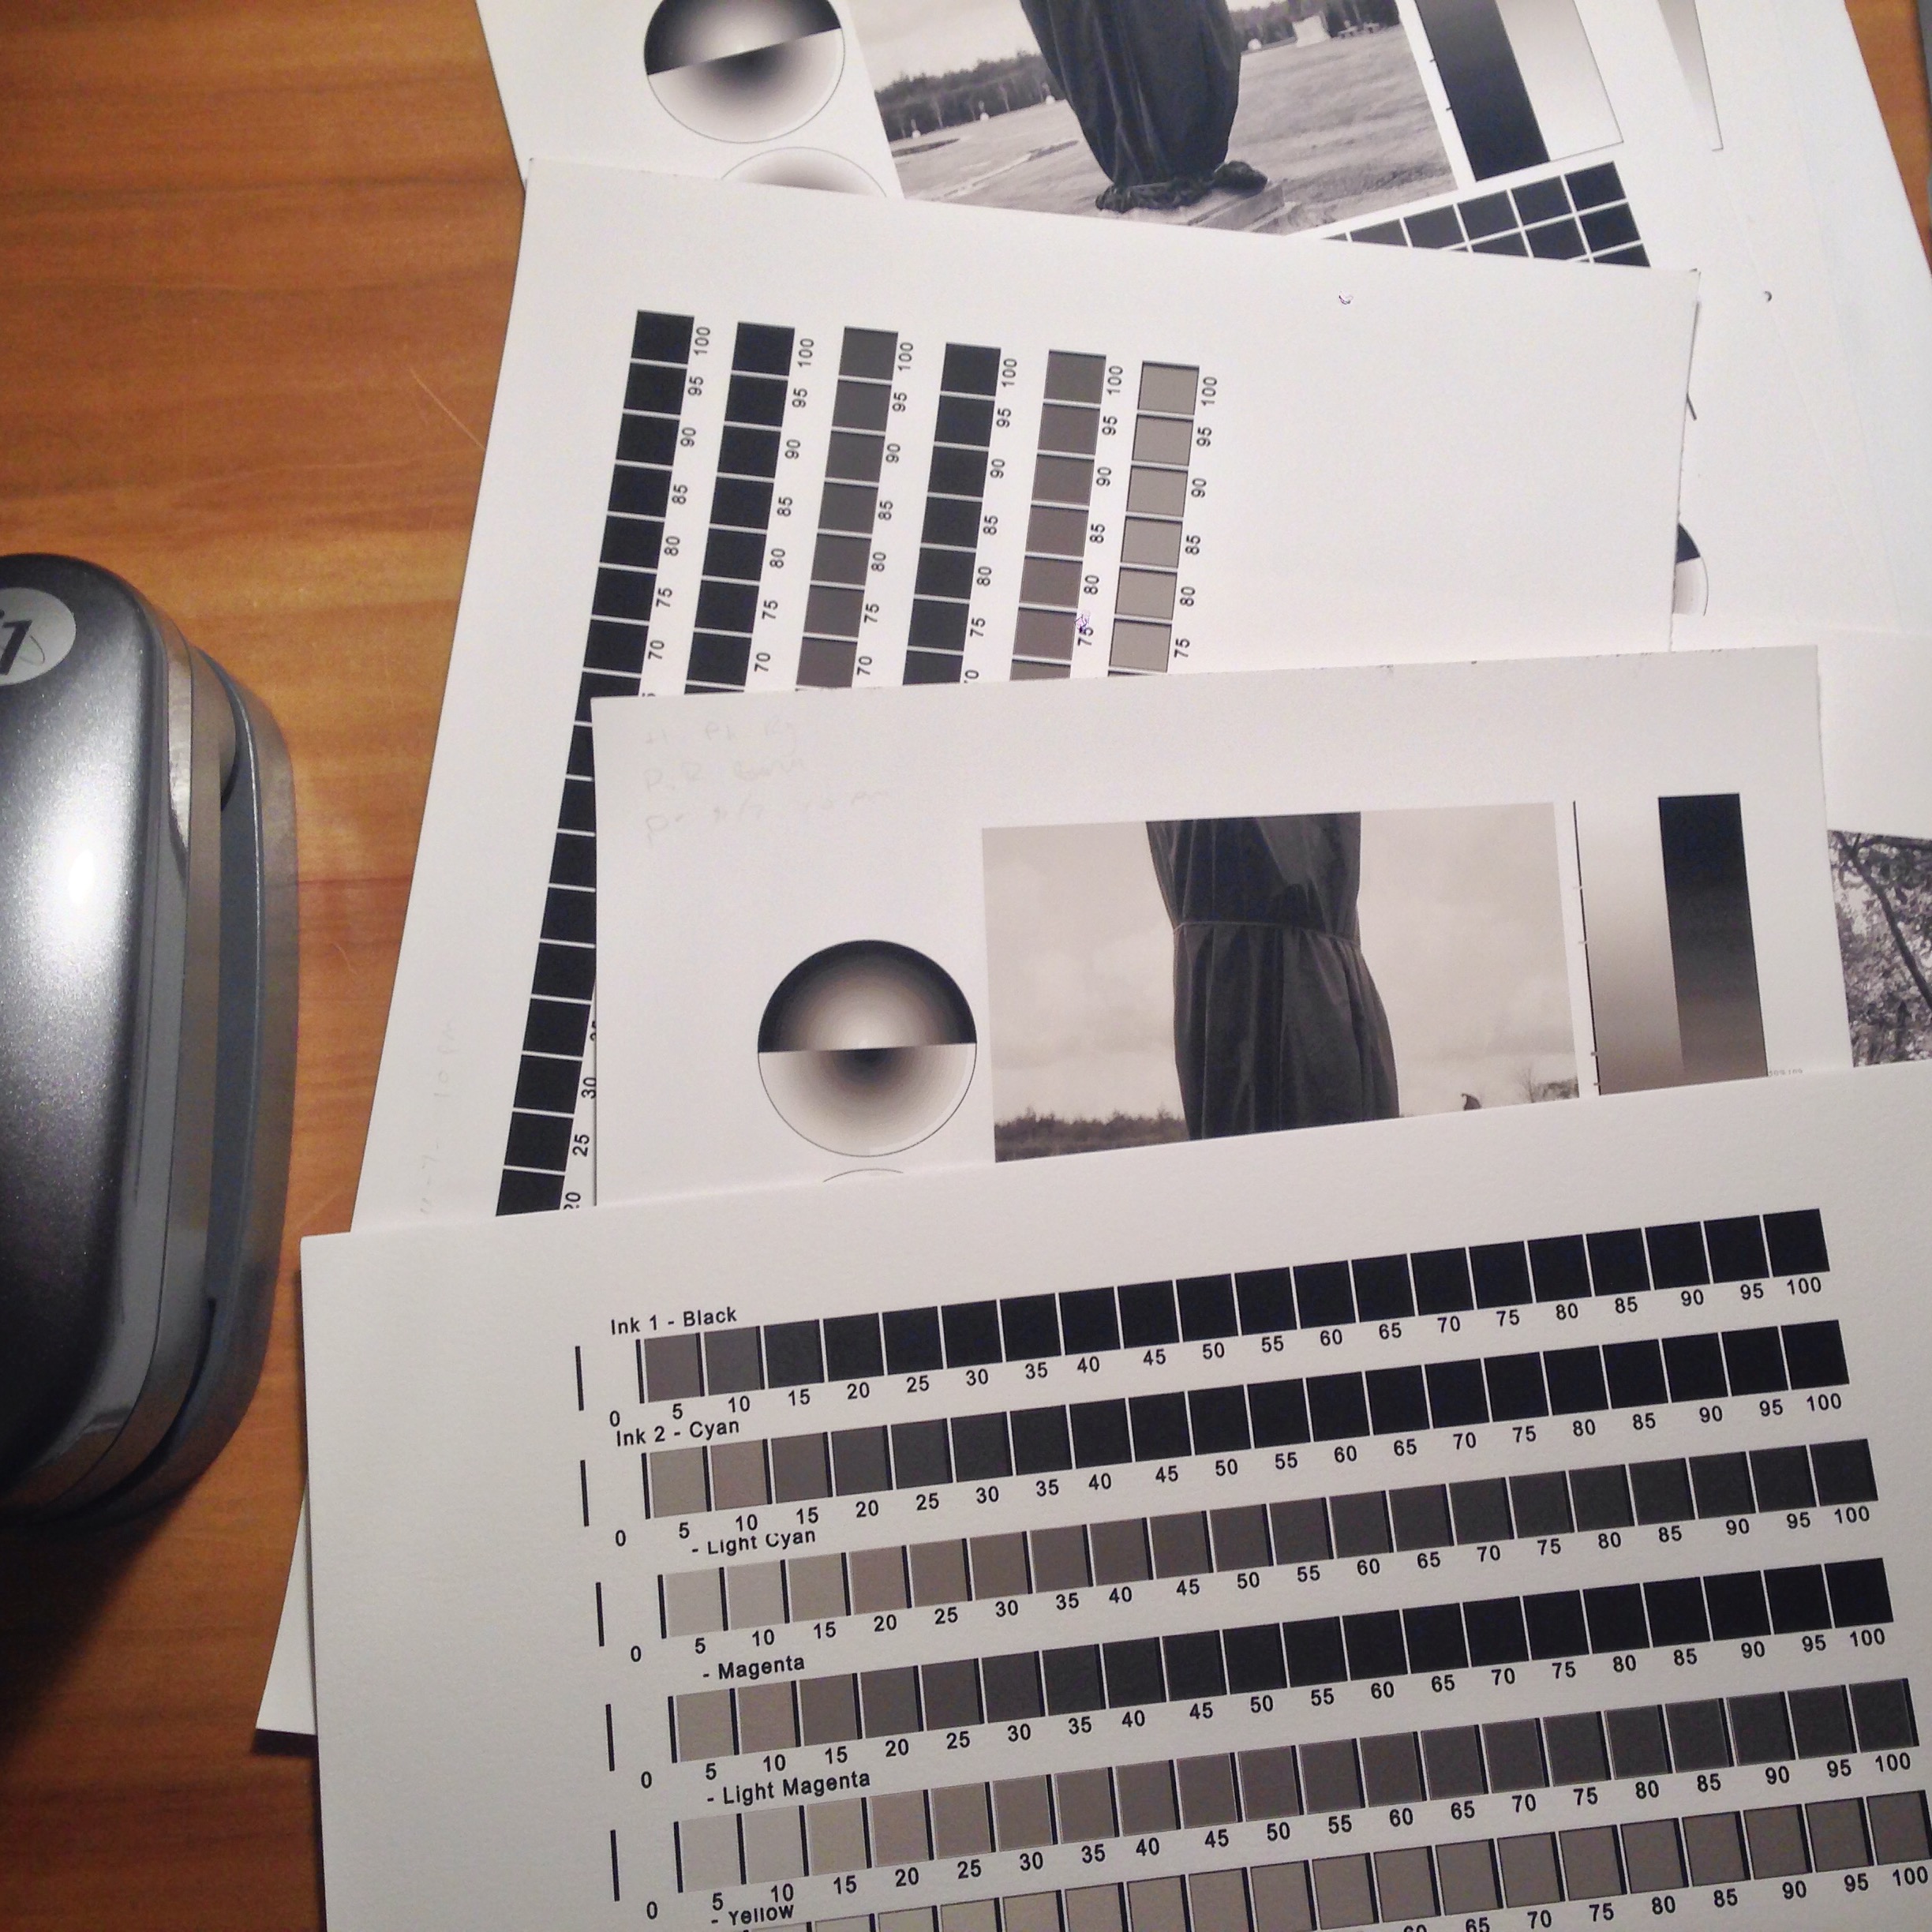
When I first begin to profile a new paper or inkset, I start by printing and measuring the densities of the separate ink channels. These are printed at 100% so I can see what the maximum ink load the paper is capable of handling, and to see how the paper responds to different inks. One paper might be better with one inkset over an other, and a different paper might respond completely opposite. This in't crucial, but interesting when determining what few papers you might decide to settle on.
I print the ink separation page at 100% of the ink limit, and then immediately measure the chart with an i1 Pro using MeasureTool (Measure Tool is foolproof when measuring charts compared to "smarter" programs like i1 Profiler or ColorPort—I am now making reference files that make this process compatible with currently supported software). When I was testing the drying times of different inks and papers for my upcoming book I would measure every these charts every three hours, but now I measure a chart at as soon as it comes out of the printer and then again about 12 hours later. I might measure again at 24 hours depending on my schedule, but in any case, I've found that after about 12 hours the prints are fully "dry" and the densities will stop shifting one way or another. I haven't yet tested how long it takes in front of a space heater or hair dryer...
The other benefit of making the measurements of the inks at 100% and then keeping the measurement file around is that if you ever have a problem with a paper or inkset you can reprint the target and compare the measurements against the ones used to make the original profile. I keep a separate folder for each paper with all the measurement files on my computer named by paper, inkset, and drying time. That might be overkill for the day to day user, but is helpful for me when writing posts like this too see how one printer does with one inkset of another. Again, I'm not recommending people do this—print the target, let it dry over night and then measure it and you'll be fine. It can be a lot of measuring, and i'm saving my pennies for an automated chart reader...
The Tests
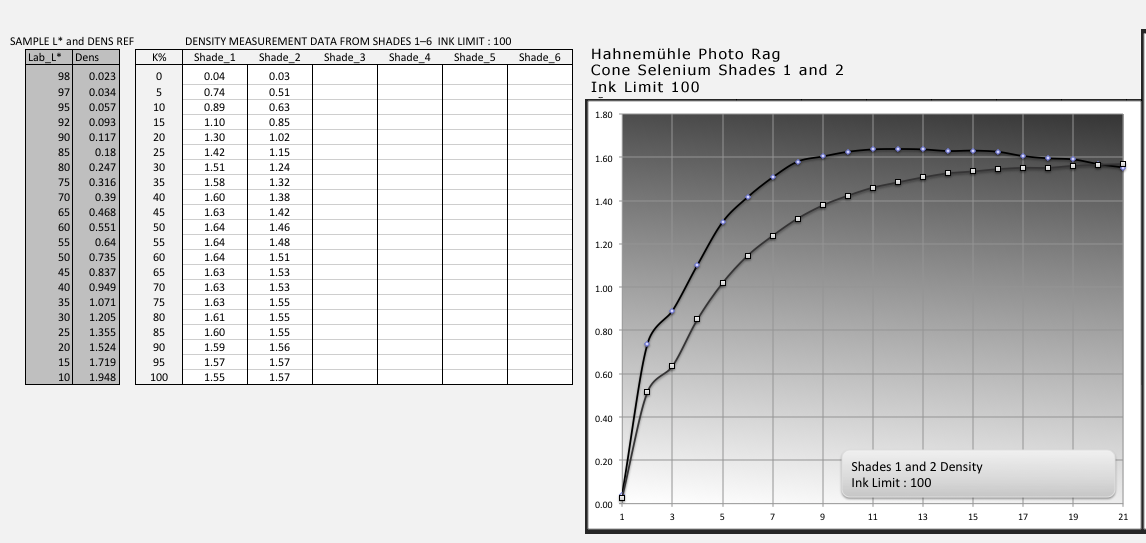
The following screen shots show the difference between shades 1 and 2 for each different ink on two different papers. After measuring the 100% ink limit targets I print the targets again with ink limits set to be evenly distributed between paper white and the D-max. Those are the limits I use to make the QTR profile. The Flat parts of the ink curve is something that I have only found with the Epson 1430 printer, and happens at about the same point for each ink and I suspect it is a function of the dithering algorithm.
One large difference between the two inksets is that the Cone Shade 2 is a darker dilution than the Ebony Shade 2. The other is that the shade 1 in Ebony inkset tends to reach its D-max sooner and then levels off with only a slight decrease in density after the paper is fully saturated. The Cone shade 1 tends to drop off much faster and isn't as forgiving if the ink limit for shade 1 is set too high. A point about setting ink limits for shade 1: I actually don't recommend people set the ink limit for shade 1 at the absolute D-max since it can block up a sooner and give you problems when you go to linearize the gray curve. I set my ink limit to the point before it starts to level off and then use the "BOOST_K=" option set to a point 5-10 points above the K ink limit.
The screen shots below are from my measurements of Canson Rag Photographique and Hahnemühle Photo Rag 188. The graph is part of my spreadsheet template I developed for QTR profile creation, and which will be made available with my upcoming QTR book.