I don't mean for this to become a site dedicated to printing with QuadToneRIP, and I have a few new exciting things waiting in the wings that will be coming out in the next few months. In the mean time, here is a little tool I put together for automatically creating a QTR correction curve based on any 21-step measurement file, and outputs a set of input and output points that can be pasted into the QTR ink descriptor file. This takes the place of the option to embedded a Photoshop .acv curve in the gray_curve= line and eliminates the problem of clobbering your profile if you move or edit the .acv file.
Anyone who has made their own QTR profiles has probably incountered the annoying "Lab values not in order" error when trying to linearize their profile. While this tool might not solve that problem completely, it should produe a profile that will print with a fairly straight-line density increase that should get you through the final linearization steps without any additional problems.
I have not tested this for creating a correction curve for printing inkjet negatives for alternative processes, but it should would for that as well—at least in theory...
The instructions and screenshots below show the steps for aMac, but the process is nearly identical for the Windows QTRgui (or when working with the ink descriptor file in a plain text editor on Windows).
Step-by-Step Instructions
- Print and measure the standard 21-step target with the base raw profile (a profile without any inputs in the gray_curve= or linearize= lines).
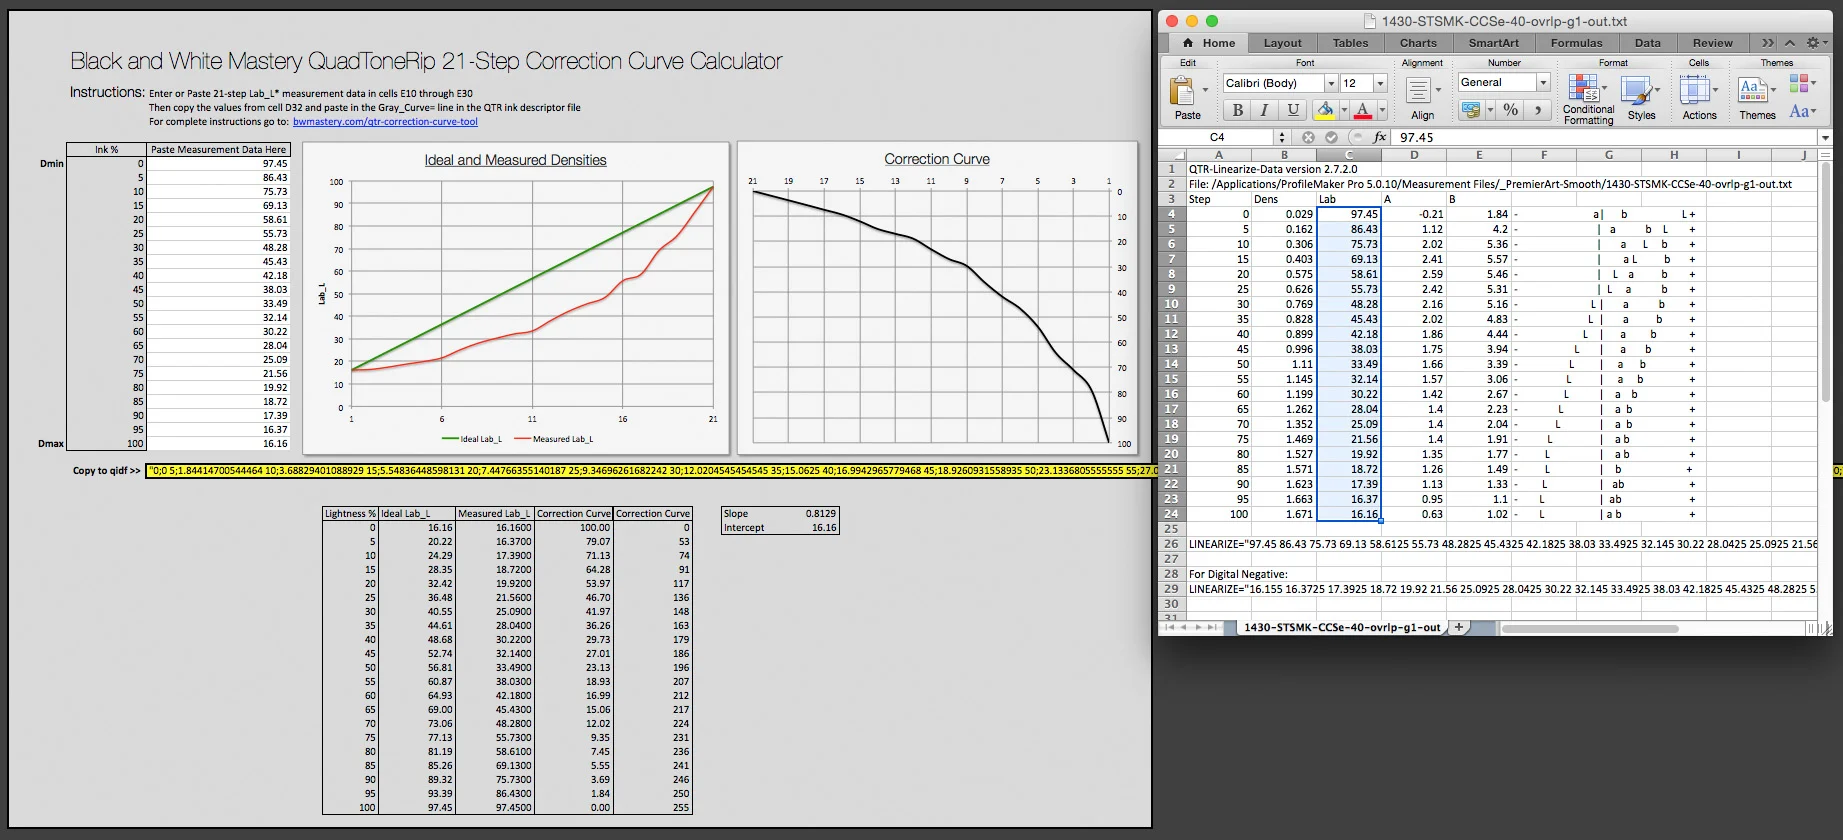
- Run the measurement file through the QTR-Linearize-Data applet to parse the Lab_L data into a nice neat column.
- Select all and copy everything—text graph and all—to your clipboard (cmd/ctrl+a then cmd/ctrl+c)
- Create a new blank Excel workbook and paste the text file data into it.
- Select ONLY the cells with Lab_L Values (all 21 of them)
- Open the BWMASTERY-21-step-QTR-Correction-Curve-Tool Excel template found below and paste the Lab\L measurements into cells E10 through E30 (you can simply select cell E10 and press cmd/ctrl+v to auto fill the rest of the cells)
- Select the highlighted cell E32 and copy and paste it to the Gray_Curve= Line in the ink descriptor file.
- Save the profile with a unique name and then install the profile like normal to create a new set of overlapping QTR curves using this new correction curve.


The resulting profile should print nearly linear and can be fine tuned with the standard linearization process.
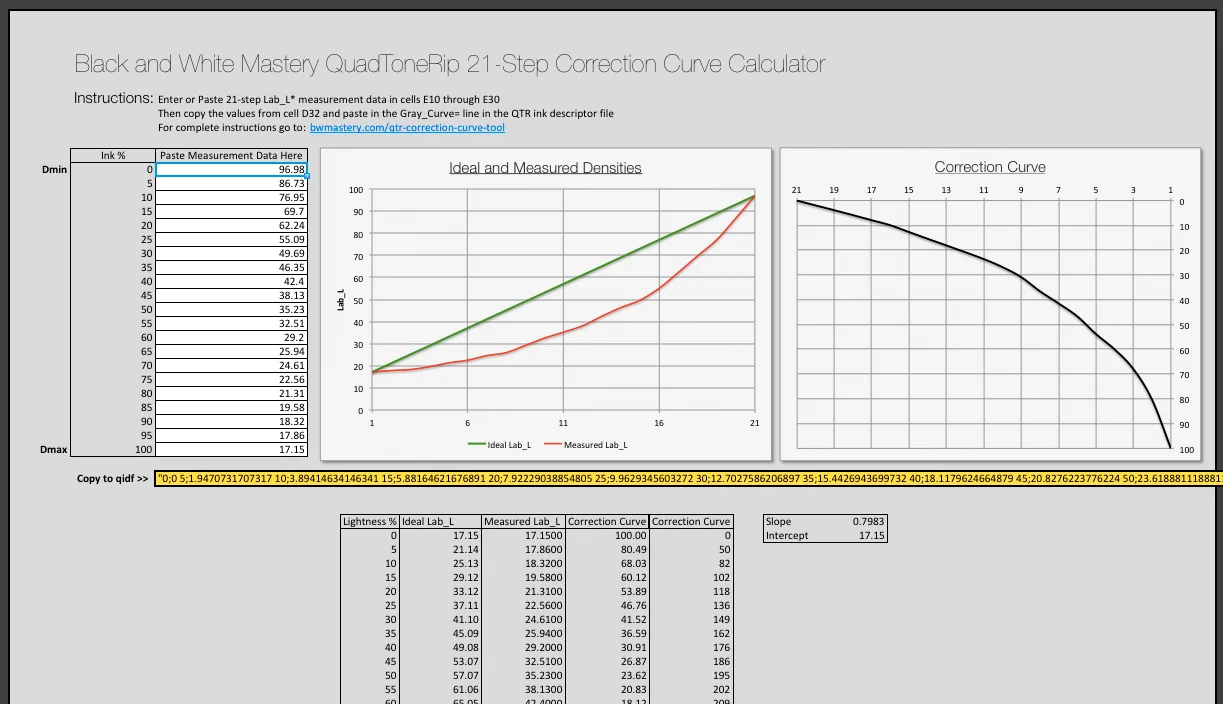
The next few screenshots are of the ink graphs from a custom six-shade carbon/selenium blend I made for an upcoming show in August. I intentionally created the raw profile to print much darker and blocked up than I would have normally created it to demonsrate how close the correction curve can get to a QTR linearized profile. There were no reverals in the initial curve so the standard linearization would have worked. Similar to the new Linearize-Quad app Roy Harrington recently released, this tool effectively allows for a two-step linearization process. It might not be right for every situation, but is good to have in the tool box so you can get through profiling and get to printing faster.


CORRECTION CURVE RESULTS
I did a series of controlled tests this morning comparing measurements made from profiles using the standard QTR linearization method to those using the correction curve tool I created. I tested 4 variations of a new custom 6- ink profile using a mixture of Cone Carbon mixed with Cone Selenium shades 2-6 and STS Matte Black as a Shade 1. The same 21x4 measurement file was used to create a QTR linearization and Correction Curve for each of the different variations of the profile to ensure that a errors in the readings were not the cause of any irregularities between the two.