
Use i1 Profiler for custom Black and White QuadTone RIP curves and ICC profiles
I posted a few different i1 Profiler workflows earlier this year for targets used in QTR profiling process. Since then I have done a little more experimenting, and it is time to post an updated workflow that makes measuring different kinds of charts easier and less prone to errors.
The previous workflows required specially formatted patch charts and reference files for i1 Profiler. I actually held off using i1 Profiler for a long time because I thought it was trying to be too smart with the kind of targets and the patch layout, and the way they are measures. I was doing everything I could think of to try to trick it into working the way I needed it to for my QTR profiling process. Then I stumbled onto something that changed everything and makes i1 Profiler much more flexible.
With this new workflow, you can use the same step wedges that came with QuadToneRIP and completely ignore the reference file. That is the huge difference from the old way of working with MeasureTool and how I previously understood i1 Profiler to work with reference files. This new method allows you to simply define the structure of your chart and then measure it. Since there is no expected measurement value for any patch it cuts down on the “expected to find 21 patches but only read 19” kinds of errors. I still use the older i1 Pro measurement device and have had no problems with this way of working setting up a couple new printers, and have been teaching it in a few private QTR workshops for the past few weeks.
This is not limited to creating custom QTR curves. This workflow and the measurement files it produces can be used for creating custom gray scale ICC profiles for Epson ABW, Canon, or HP printers. However, you will need to the QTR download to get the QTR-Create-ICC-RGB application
i1 Profiler Step-by-Step Instructions
Choose the black and white chart you want to measure.
The most often-used step wedge in QTR is the 5%, 21-step target—either the 21x4 random or the simple 21-step ramp. The 21-random target was made to prevent patch-to-patch errors that can happen if there are densities in the standard 21-step target that are too close together and that the software thinks is a single patch. If you use a step wedge with gaps between each patch then you shouldn't need the random target, but it can still be a good idea because it prints each patch 4 times, and averages the densities of each of them.

Loading the target into PrintTool
Printing the target
If you are reading this it is a good bet you have an application in mind for the measurement data so I won’t go into too much detail about how or where to print your targets. I will just say that I prefer to use PrintTool on the Mac for printing test targets so I can control when and how color management is being applied before printing.

Once the target is printed you should let it dry for a few hours or overnight (or blast it w its a hair dryer for a minute or two) and then move on to i1 Profiler.
Using i1 Profiler
Launch i1 Profiler and choose the advanced radio button. Select CMYK printer, and the measure chart option.

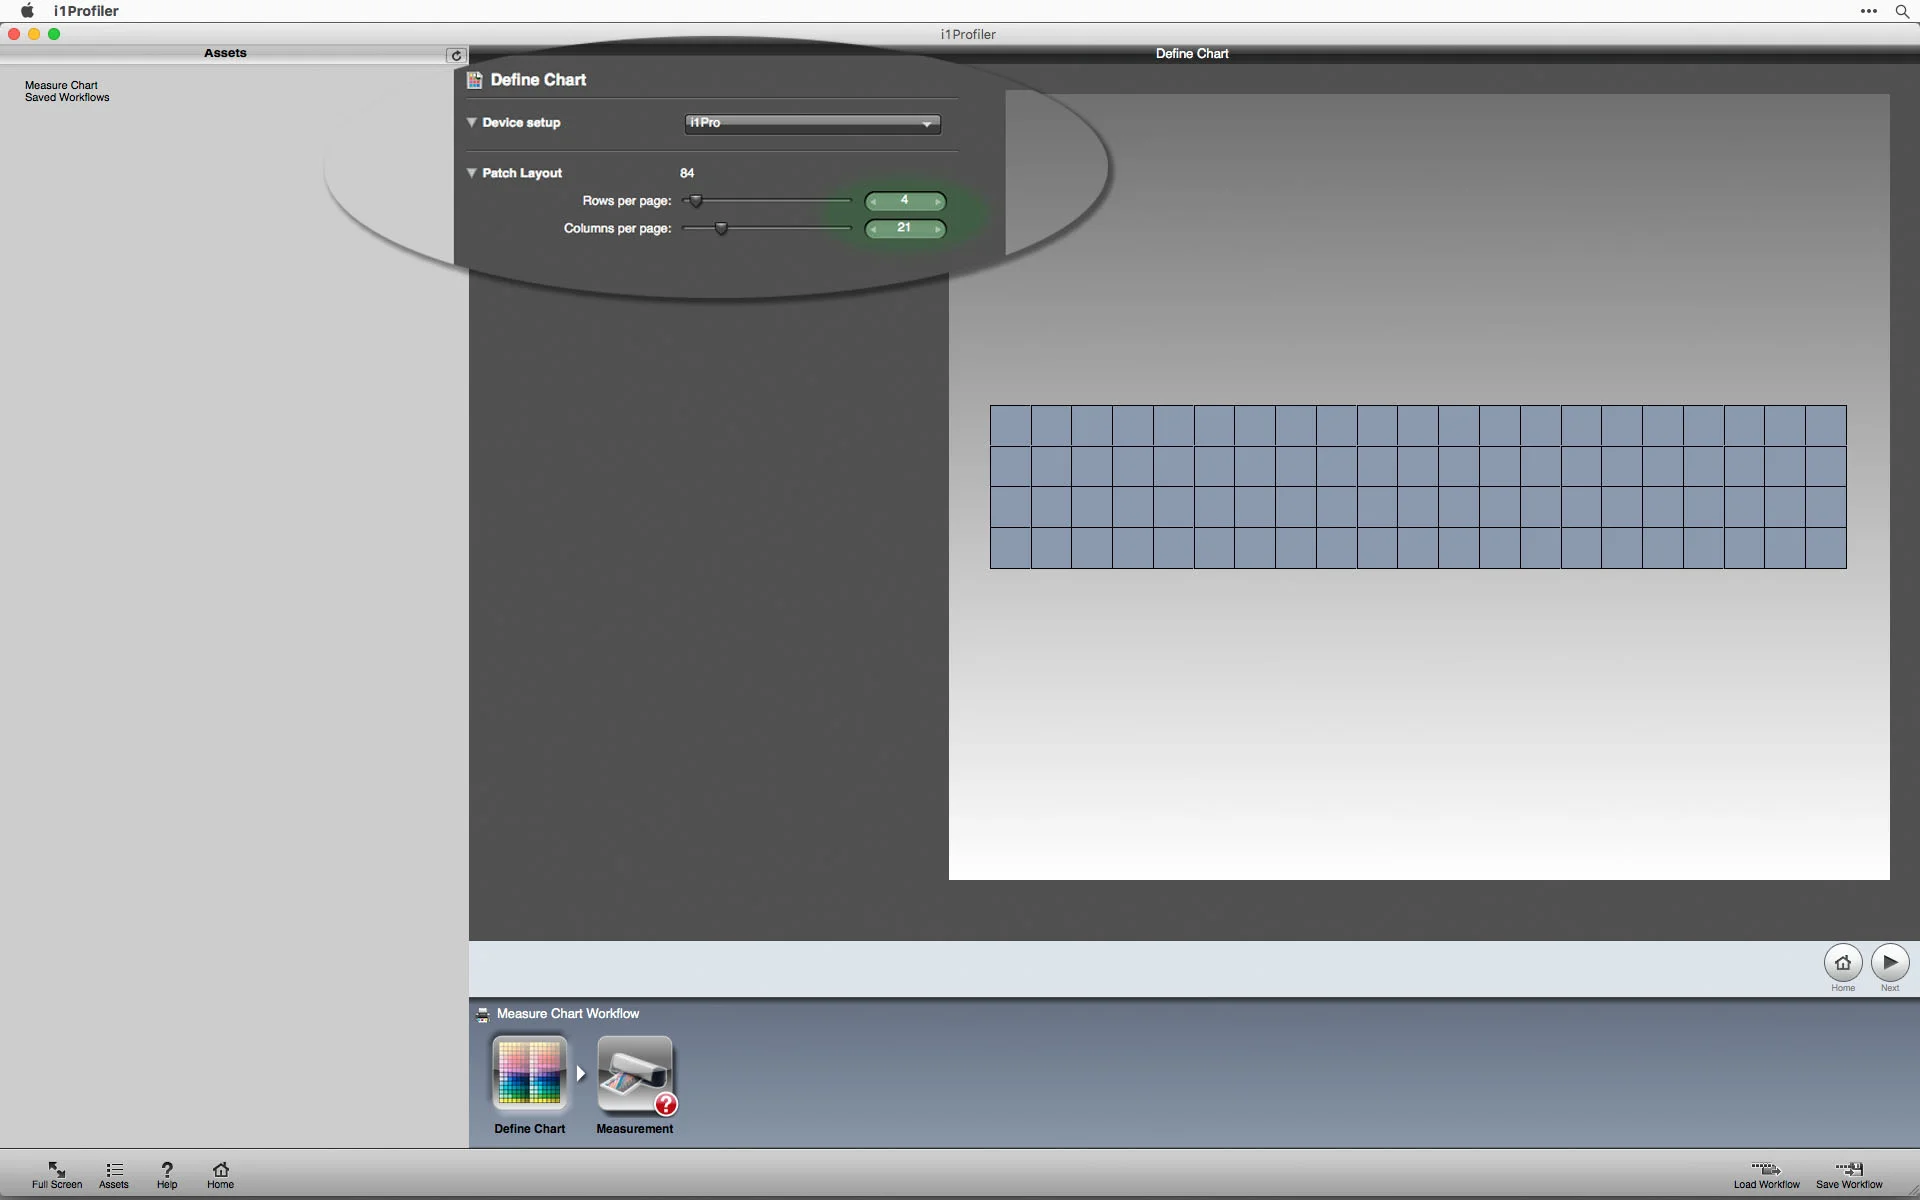
Choose the i1Profiler Measurement Chart Mode
You should see a blank chart, with options to define the chart structure. In the previous workflows I said to load a reference file to define the chart. Ignore that, and just type in the number of rows and columns in your chart.


The 21x4 random is 4 rows and 21 columns, and the 51-step chart is 3 rows and 17 columns.


If you want to use my 51x3 linearity checker use 9 rows and 17 columns, and measure the whole 51-step target 3 times. I think you will find the chart is easier to read in strip mode.
Saving the Measurement Data
You will see the option for saving page data near the bottom left of the window. Once you click that you can navigate to you measurement files folder, and create a file name that makes sense for the printer/paper/inks and the chart you are working with. Then make sure you save the chart as CGATS* (Custom) in the file format dropdown box. The next window will give you options for the measurement data to include in the file.
What data do you really need
There are a few different things that are important for using my QTR workflow, which will be detailed in my forthcoming QTR book. But for general QTR use, you will need the Sample ID, Sample Name, and L*a*b*. If you are using any of the spreadsheet templates I have posted you will also need to save the Location Info from the dropdown box on the right, as well as the XYZ data. The Location info gives the row and column position of each of the patches, and I use that location info in the spreadsheets for looking up the different patch readings. The XYZ info is included to use the XYZ_Y readings for easily calculating Density (without going through a conversion of L*a*b*_L* to XYZ_Y to Density). The QTR-Linearize-Data and QTR-Create-ICC scripts will do this L*a*b* to density conversion for you if you do not have the XYZ data.
You can see the screenshot with the rest of the default options I leave alone in the lower portion of the window. Once you hit ok, it will create the measurement .txt file that you can open in a text editor, in Excel, or run through the various QTR applications. Using the measurement data Now that you have saved the data you need to navigate to it. This is when having it organized and saved in a different location comes in handy.


I mentioned this in the previous posts, but it bears repeating. i1 Profiler will want to save the measurement files in its default location, which is buried in the application support folder, and it won’t remember where you saved any previous measurements if it wasn’t in that default folder. I encourage everyone to create a different folder for all your measurement files in your documents directory, or the desktop, or some other easy to get to place on your hard drive. Then within that folder create different folders for each of the different papers you will use. Working with the measurement files will be a lot easier if they are organized and easily accessible for however you are going to use them later in the process, or referring back to them at some point in the future.
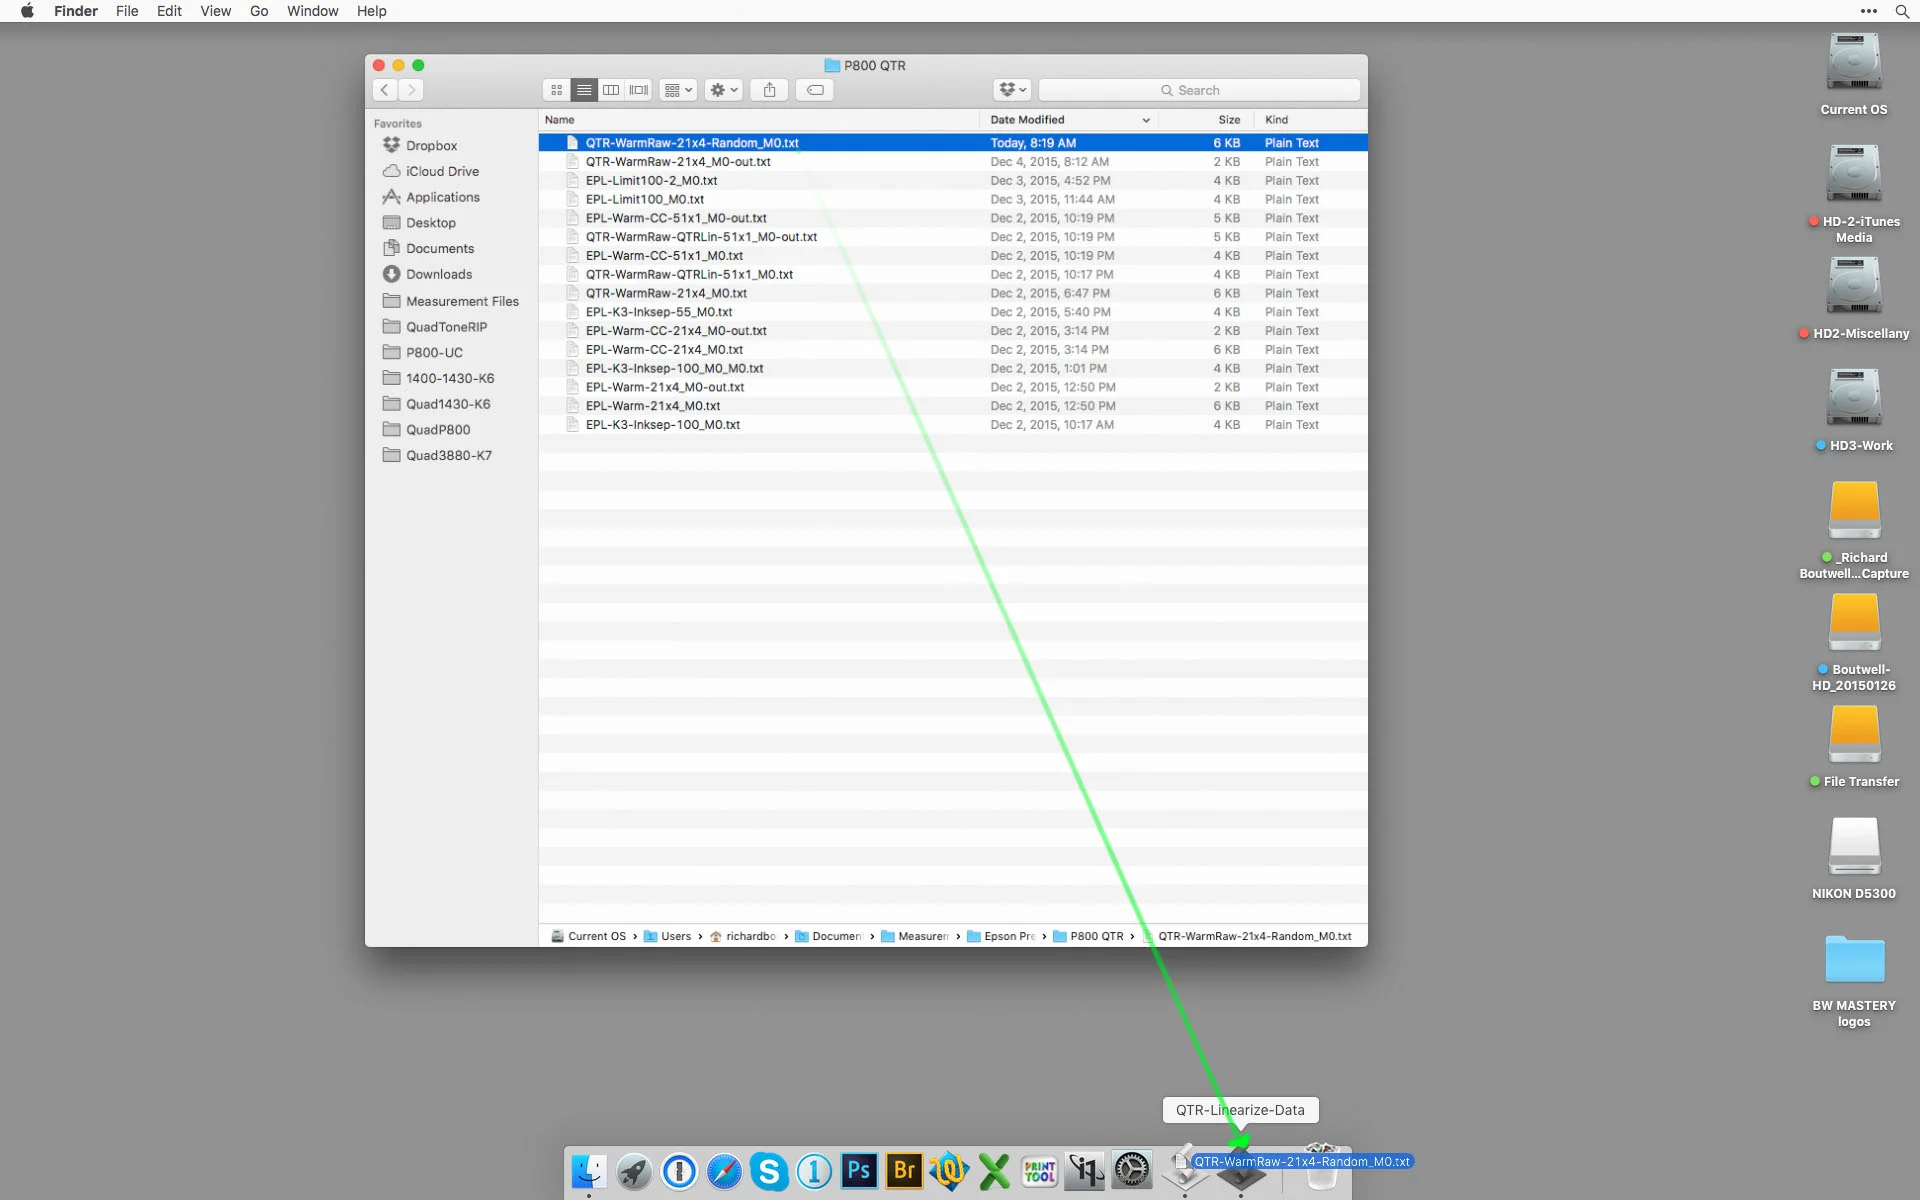
Using the Measurement DAta
If you are at the QTR Linearization or confirming successful linearization steps make sure you launch the QTR-Linearize-Data application (some people call it a droplet or script) and then drag the measurement file onto the QTR-Linearize-Data icon in the dock, and you will get an new measurement-file-name-out.txt file that graphs the measurement data and give you a string to paste into the QIDF text file.

You can use the same original measurement data files with the QTR-Create-ICC application. It works similarly to the QTR-Linearize-Data application, but also creates an ICC profile that you can use for color management and soft proofing.
I will be posting more Excel templates that have been updated and formatted to for this new workflow. Until then, you can just select and copy the cells with the XYZ through the Lab* data and then paste into those cells in the current templates.